Visualization of GO enrichment analysis with dotplot, cnetplot, or emapplot in clusterProfiler
Usage
plot_GO(
  go_list,
  plot_dotplot = TRUE,
  plot_cnetplot = FALSE,
  plot_emapplot = FALSE,
  showCategory_dotplot = 5,
  showCategory_cnetplot = 5,
  showCategory_emapplot = 5,
  fontsize = 8,
  label = "genes",
  ...
)
Arguments
- go_list
A list of enriched GO results, output from
enrichGO_list()- plot_dotplot
Whether to plot dotplot (default is TRUE)
- plot_cnetplot
Whether to plot cnetplot (default is FALSE)
- plot_emapplot
Whether to plot emapplot (default is FALSE)
- showCategory_dotplot
showCategory parameter of
clusterProfiler::dotplot()(default is 5)- showCategory_cnetplot
showCategory parameter of
clusterProfiler::cnetplot()(default is 5)- showCategory_emapplot
showCategory parameter of
clusterProfiler::emapplot()(default is 5)- fontsize
Font size for the plots (default is 8)
- label
Title for the plots (default is "genes")
- ...
Additional parameters to pass to the plotting functions
clusterProfiler::dotplot(),clusterProfiler::cnetplot(), orclusterProfiler::emapplot()
Examples
data(example_go)
plot_GO(example_go$all, plot_dotplot = TRUE,
plot_emapplot = FALSE, plot_cnetplot = FALSE)
#> $dotplot_BP
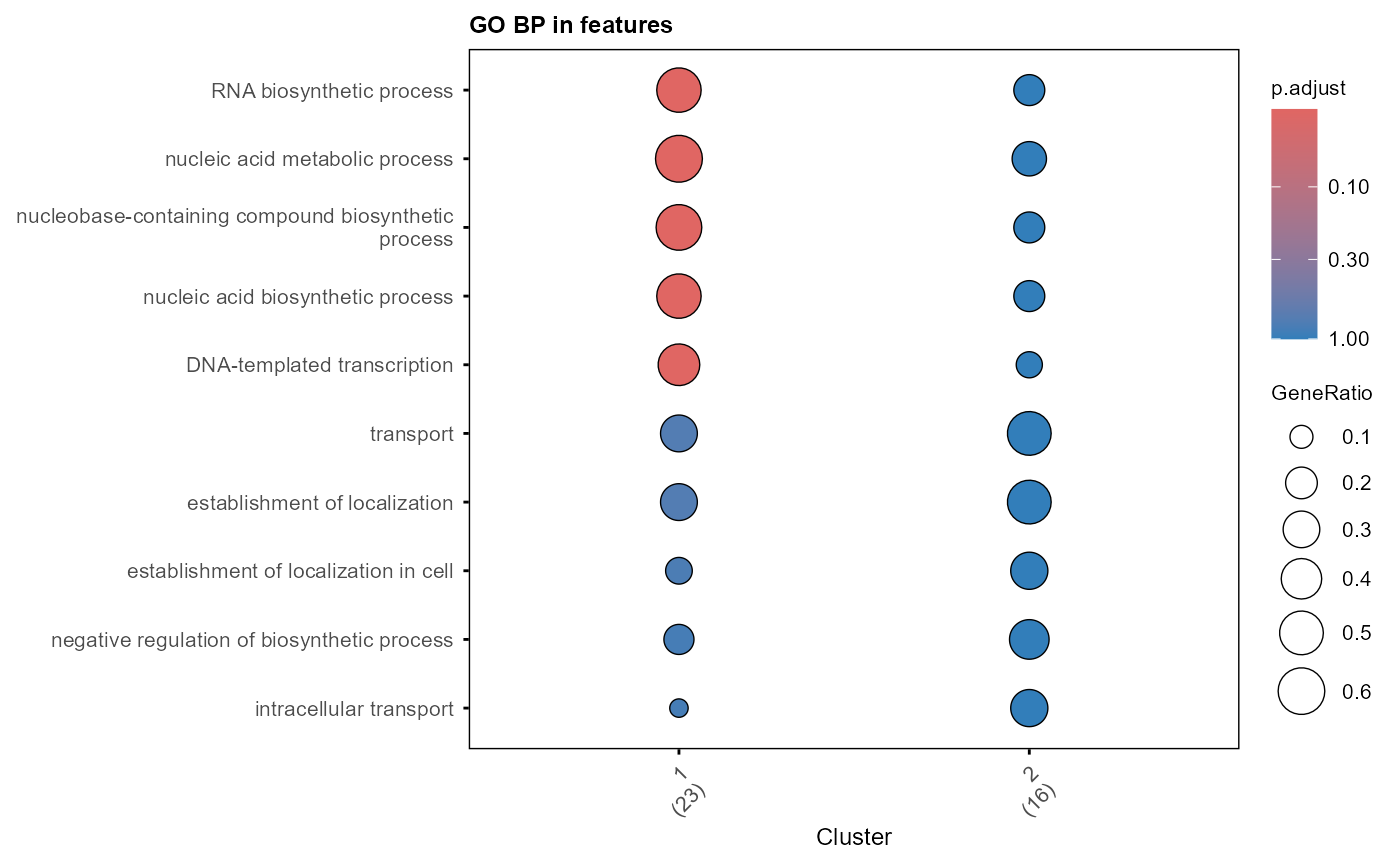 #>
#> $dotplot_CC
#>
#> $dotplot_CC
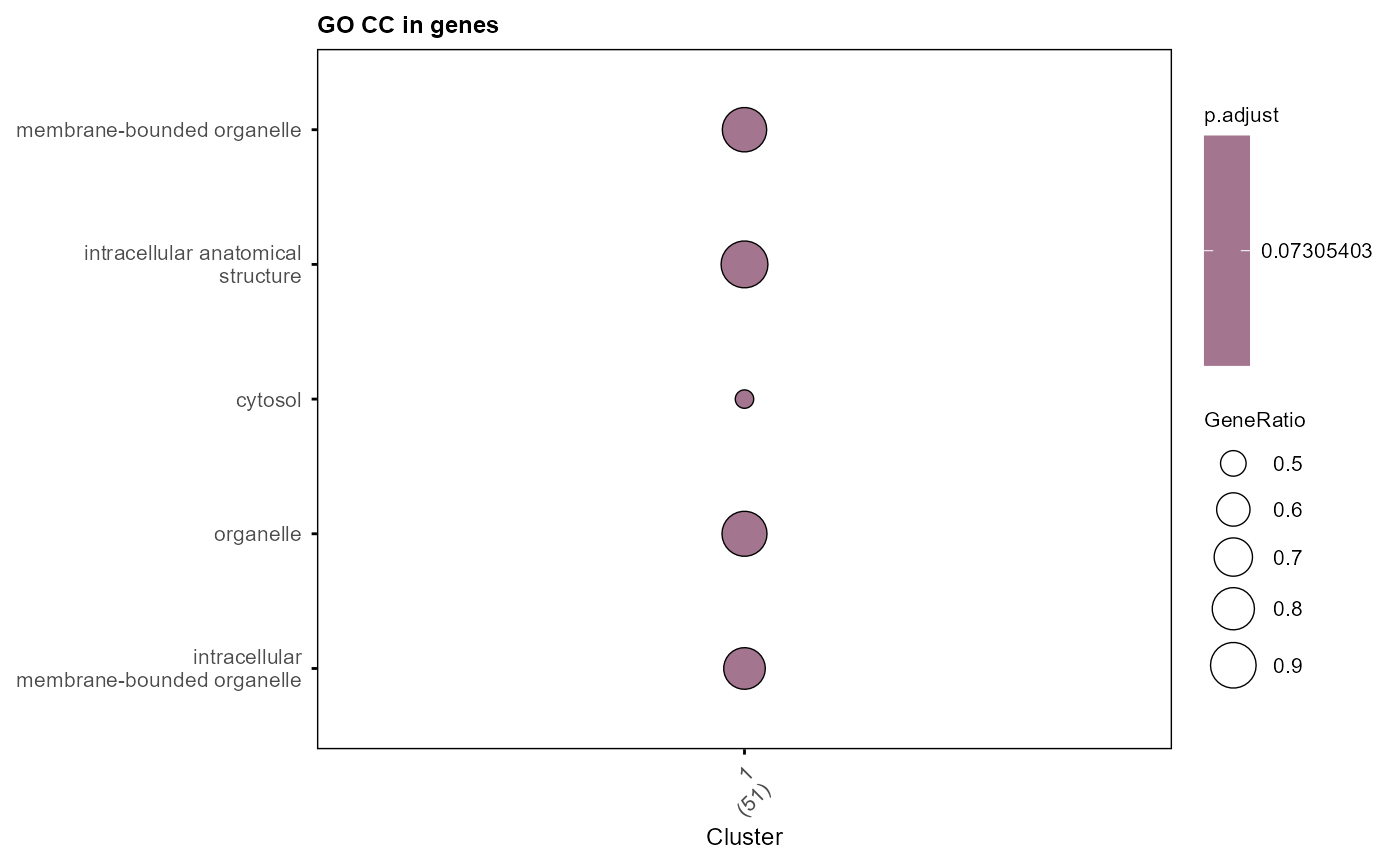 #>
#>