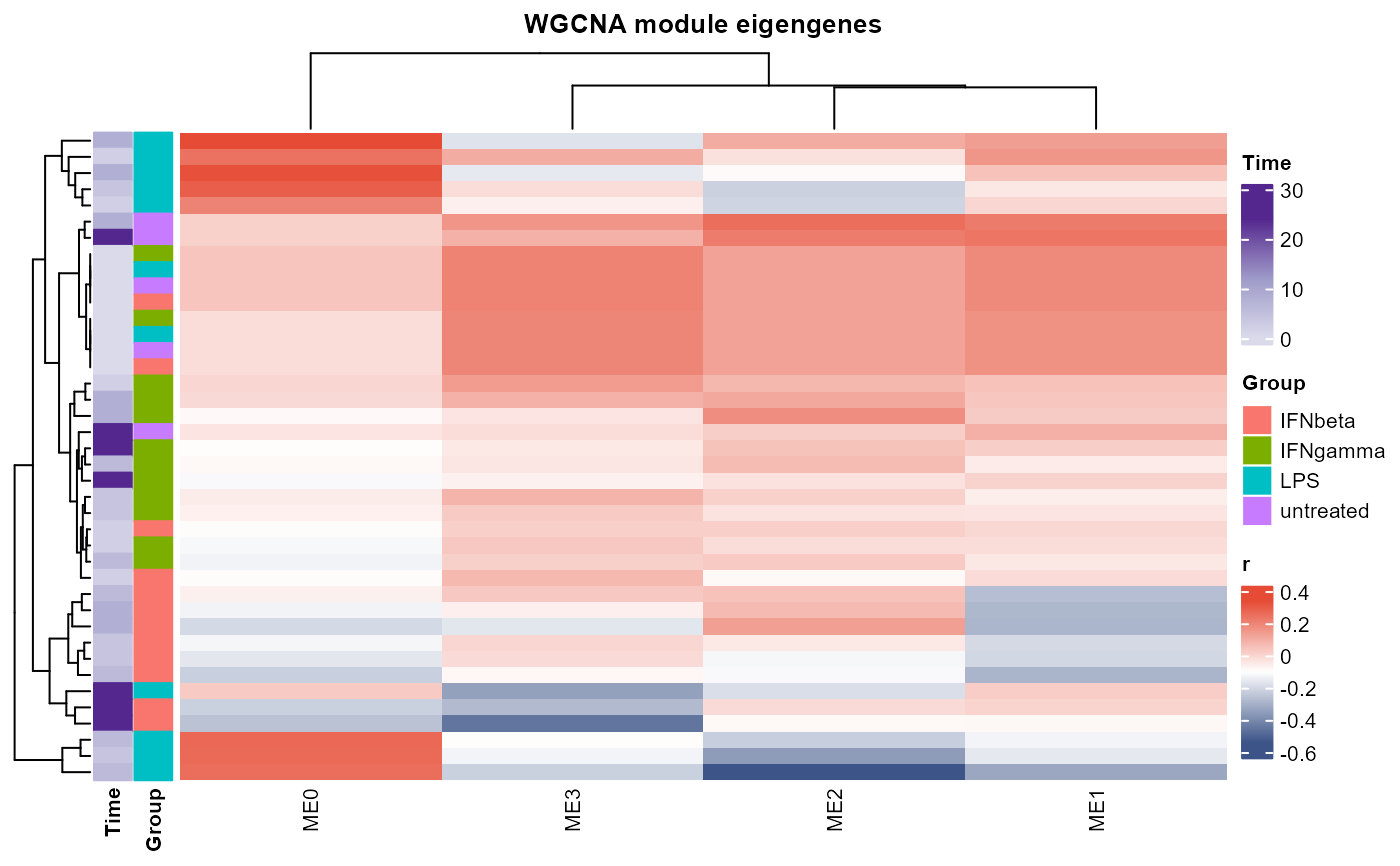
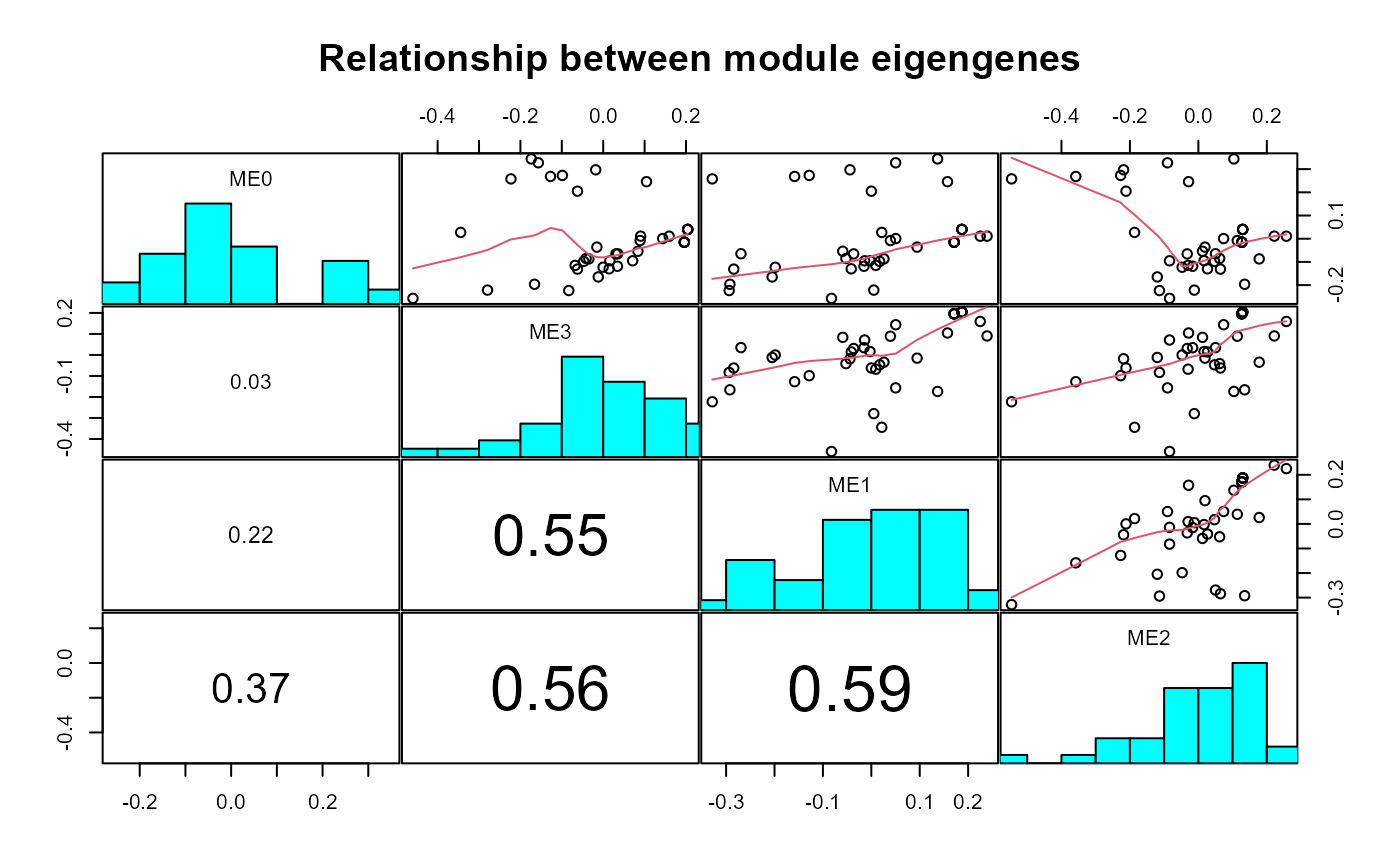
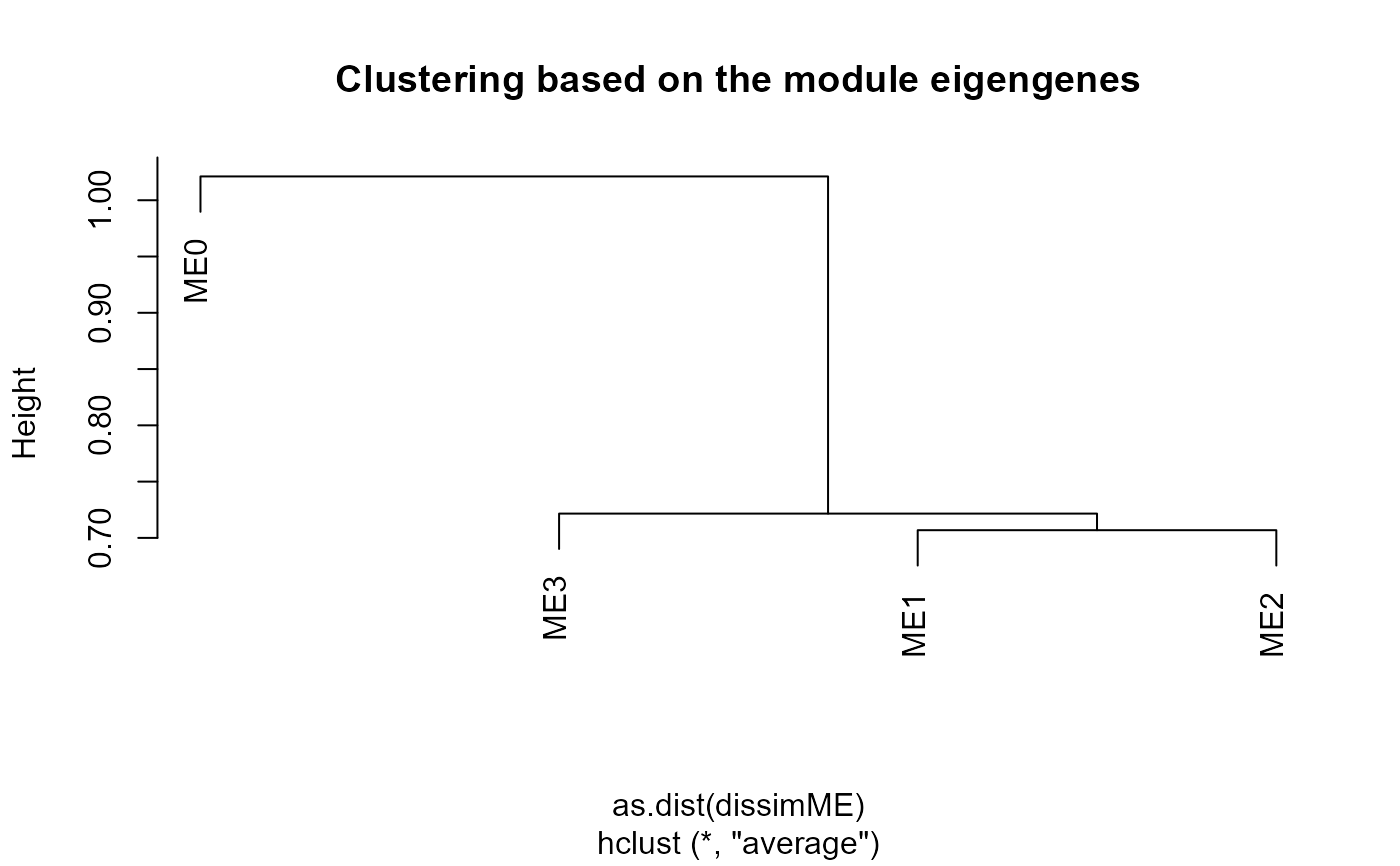
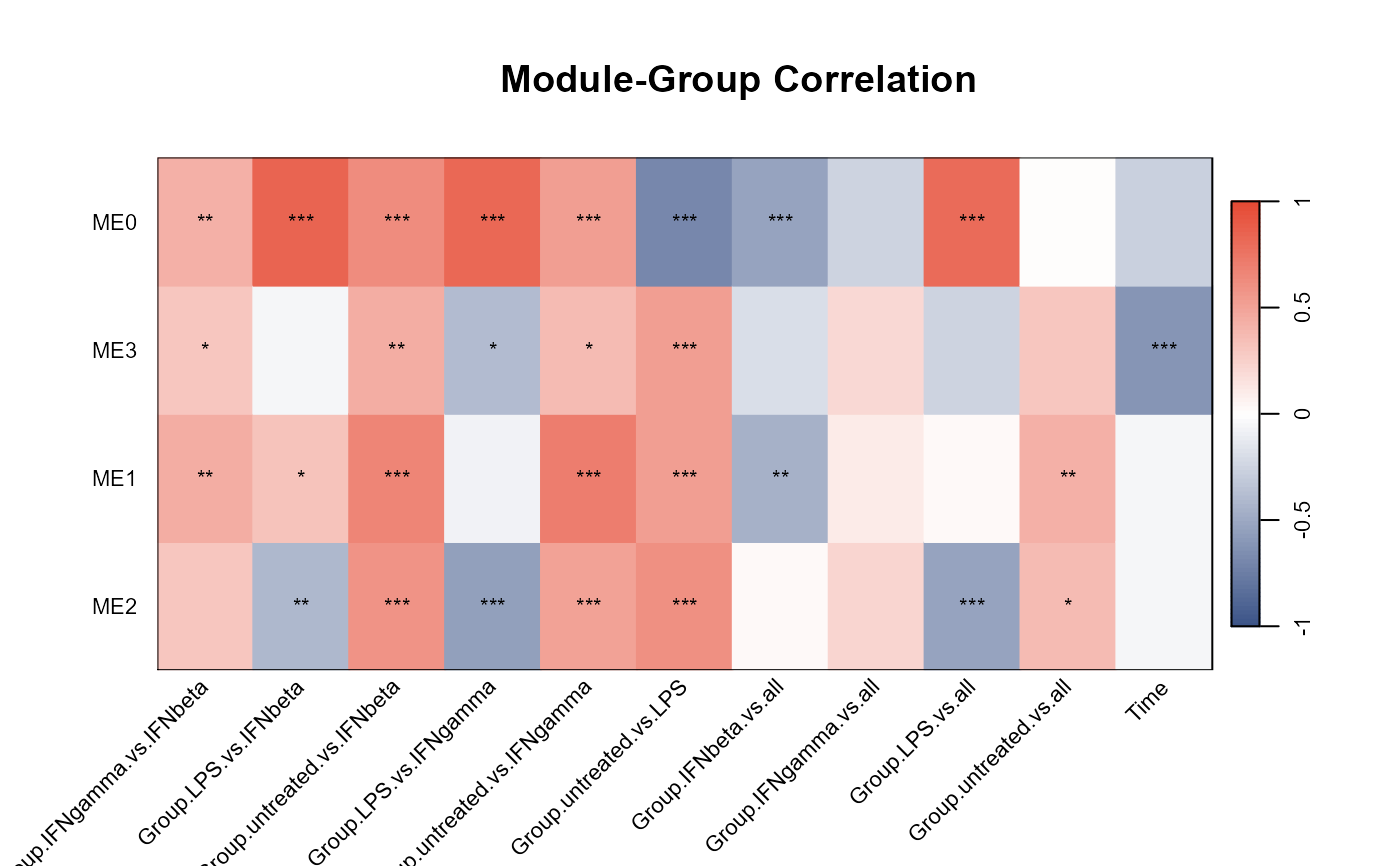
Plot WGCNA module eigengenes and module-group/time correlations
based on output of run_WGCNA()
Arguments
- net
WGCNA network object output by
run_WGCNA()- fontsize
Font size for plots (default is 8)
Value
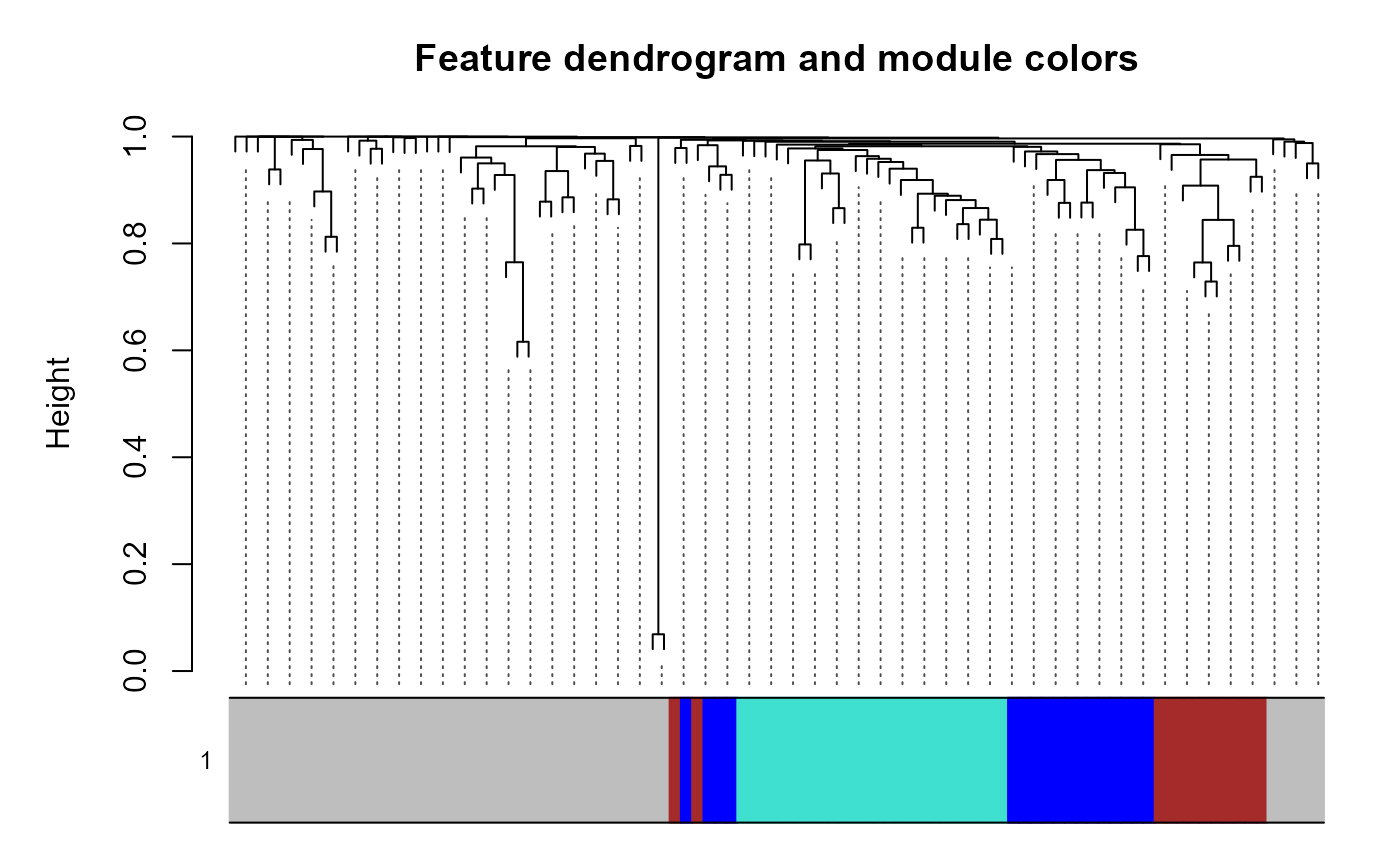
Plots of WGCNA module dendrogram, module eigengenes, pairwise scatterplots of eigengenes, clustering of module eigengenes, and module-trait correlation heatmap
References
https://github.com/edo98811/WGCNA_official_documentation/blob/main/FemaleLiver-03-relateModsToExt.R
Examples
data(example_obj)
example_obj <- normalise_to_start(example_obj)
#> Normalising to group baseline at each feature's first non-NA time point.

data("example_net")
plot_WGCNA(example_net, fontsize = 8)

#> Warning: argument 1 does not name a graphical parameter
#> Warning: argument 1 does not name a graphical parameter
#> Warning: argument 1 does not name a graphical parameter
#> Warning: argument 1 does not name a graphical parameter
#> Warning: argument 1 does not name a graphical parameter
#> Warning: argument 1 does not name a graphical parameter
#> Warning: argument 1 does not name a graphical parameter
#> Warning: argument 1 does not name a graphical parameter
#> Warning: argument 1 does not name a graphical parameter
#> Warning: argument 1 does not name a graphical parameter
#> Warning: argument 1 does not name a graphical parameter