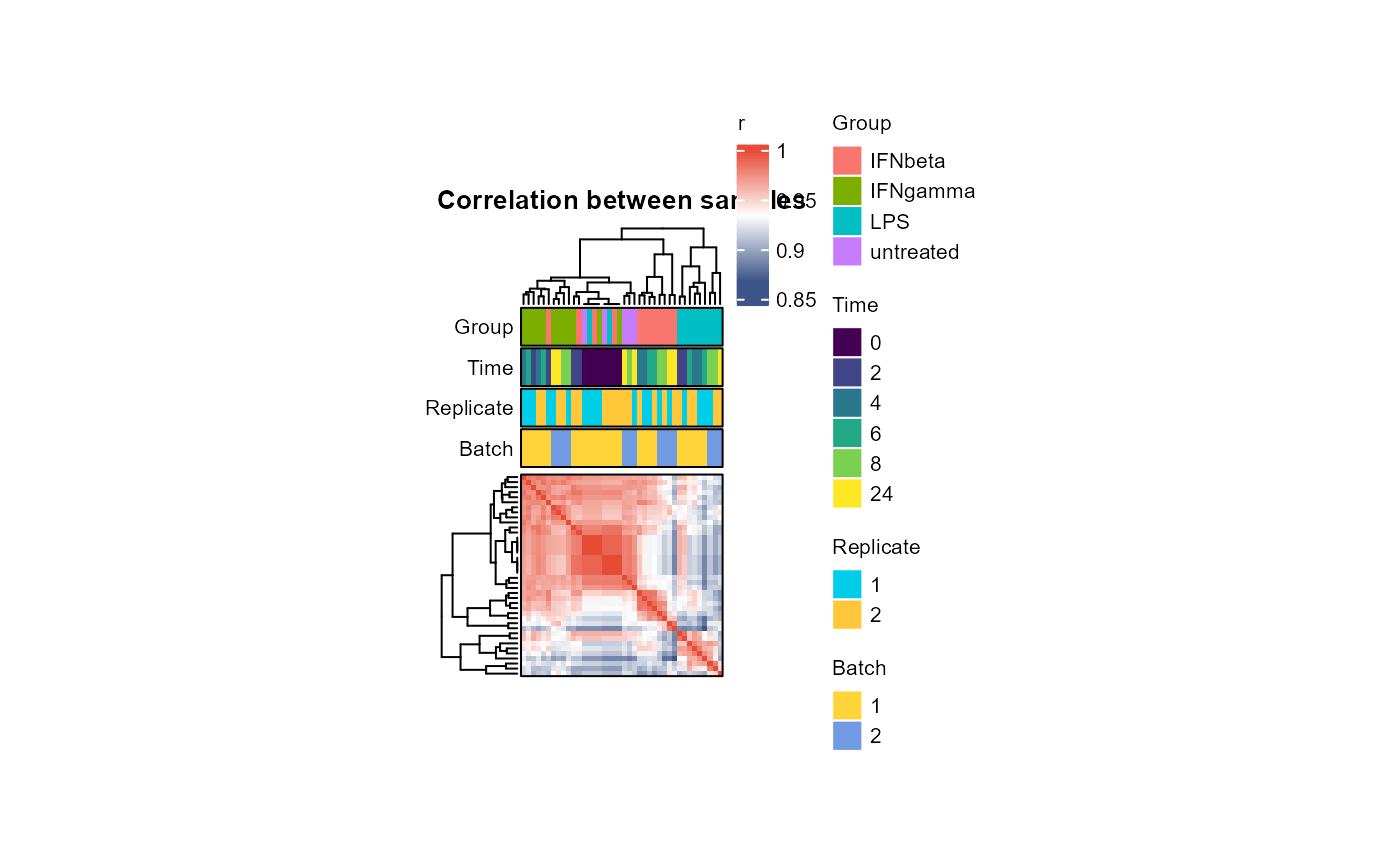
Plot correlation matrix between samples as a heatmap
Usage
plot_cor_matrix(
  se_obj,
  assay = 1,
  use = "pairwise.complete.obs",
  method = c("spearman", "pearson", "kendall"),
  label_group = TRUE,
  label_time = TRUE,
  label_rep = TRUE,
  label_batch = TRUE,
  show_rownames = FALSE,
  show_colnames = FALSE,
  fontsize = 8,
  cellwidth = 1,
  cellheight = 1,
  title = "Correlation between samples",
  ...
)
Arguments
- se_obj
A SummarizedExperiment object created by
create_input()- assay
Assay to use:
"orig"for original data,"norm"for normalised-to-start data. Numeric indices (1, 2) are also accepted. (default is 1, the original data).- use
Parameter of
stats::cor()(default is "pairwise.complete.obs")- method
Parameter of
stats::cor()(default is "spearman")- label_group
Whether to label Group (default is TRUE)
- label_time
Whether to label Time (default is TRUE)
- label_rep
Whether to label Replicate (default is TRUE)
- label_batch
Whether to label Batch (default is TRUE)
- show_rownames
Whether to show row names in the heatmap (default is FALSE)
- show_colnames
Whether to show column names in the heatmap (default is FALSE)
- fontsize
Font size for the heatmap and annotations (default is 8)
- cellwidth
Cell width for the heatmap (default is 1)
- cellheight
Cell height for the heatmap (default is 1)
- title
Title of the heatmap (default is "Correlation between samples")
- ...
Additional arguments to be passed to
ComplexHeatmap::Heatmap()
Examples
data(example_obj)
plot_cor_matrix(example_obj)