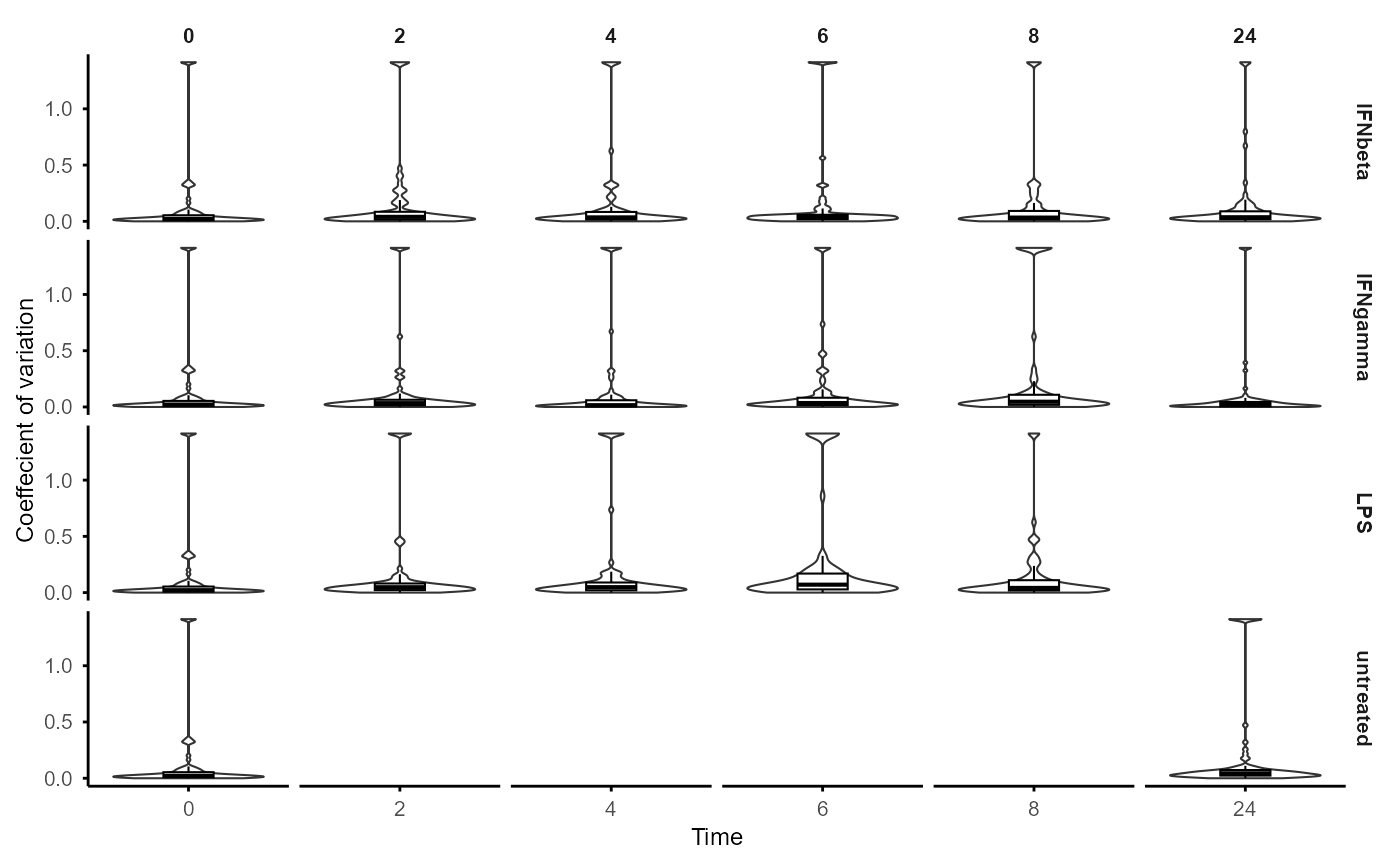
Plot the distribution of coefficient of variation (CV) for each feature with replicates. The CV is calculated as the standard deviation divided by the mean of the abundance values.
Note: CV is only meaningful for positive-valued data.
Arguments
- se_obj
A SummarizedExperiment object, produced by
create_input()function, containing the abundance data and associated sample information.- fontsize
(Optional) An integer specifying the font size for the plot (default is 8).
Value
A plot showing the distribution of coefficient of variation (CV) for each feature, grouped by Time and Group. If there are no replicates, a message will be printed indicating that CV cannot be calculated.
Examples
data(example_obj)
plot_cv(example_obj)
#> Data contains non-positive values. CV is only meaningful for positive data.
#> Warning: no non-missing arguments to min; returning Inf
#> Warning: no non-missing arguments to max; returning -Inf
#> Warning: no non-missing arguments to min; returning Inf
#> Warning: no non-missing arguments to max; returning -Inf
#> Warning: no non-missing arguments to min; returning Inf
#> Warning: no non-missing arguments to max; returning -Inf
#> Warning: no non-missing arguments to min; returning Inf
#> Warning: no non-missing arguments to max; returning -Inf
#> Warning: no non-missing arguments to min; returning Inf
#> Warning: no non-missing arguments to max; returning -Inf