This function generates density plots to visualise the distribution of abundance values across samples. The user can choose to facet the plot by "Group", "Time", or "Sample" to compare distributions across different conditions or samples. If no faceting variable is specified, a single density plot will be generated for all samples combined.
Arguments
- se_obj
A SummarizedExperiment object, produced by
create_input()function, containing the abundance data and associated sample information.- facet_by
(Optional) A character string specifying the variable to facet the plot by. It can be one of "Group", "Time", or "Sample". If NULL, no faceting will be applied and a single density plot will be generated for all samples (default is NULL).
- fontsize
(Optional) An integer specifying the font size for the plot (default is 8).
Value
A plot showing the density distribution of abundance values, optionally faceted by the specified variable.
Examples
data(example_obj)
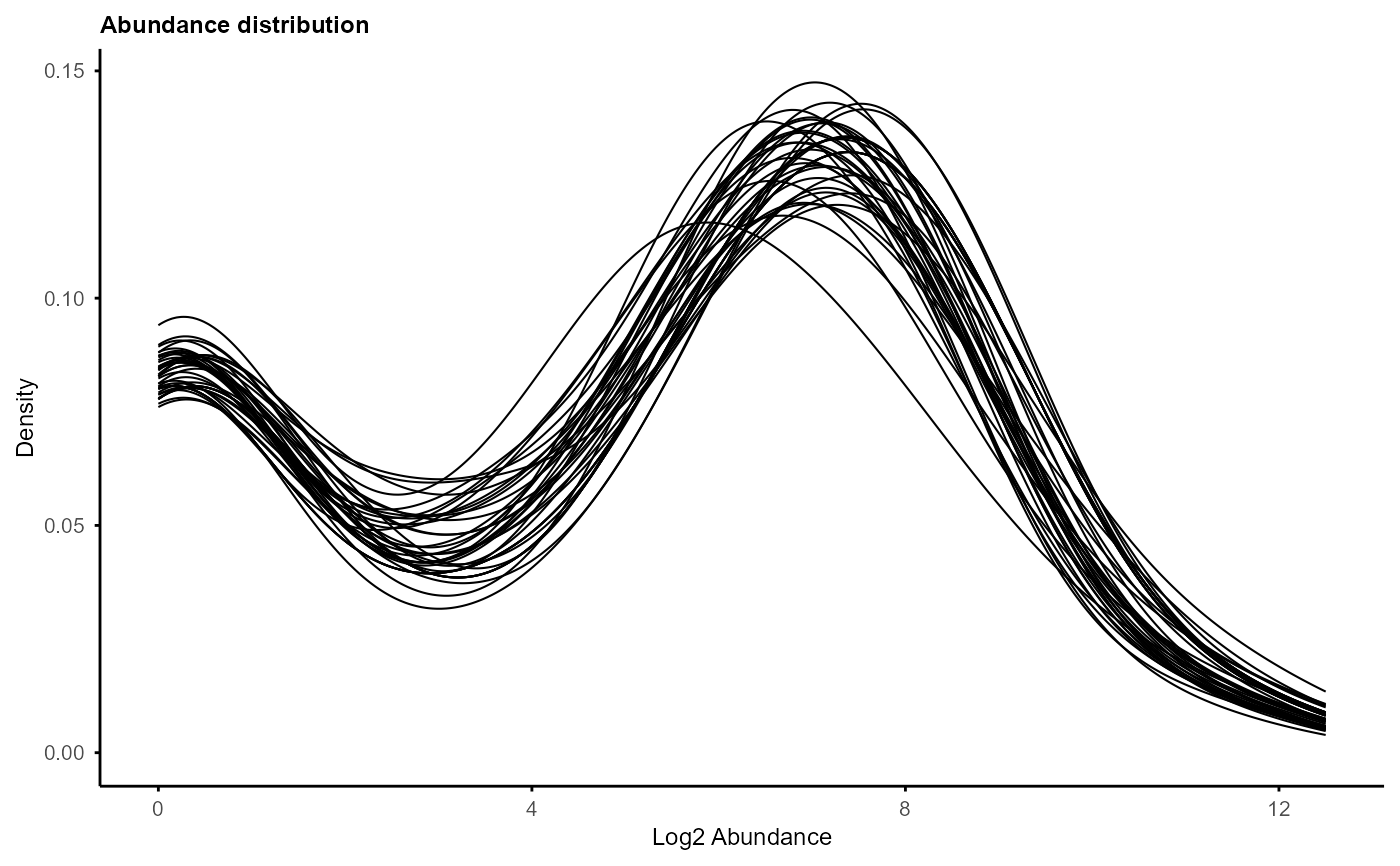
plot_distribution(example_obj)
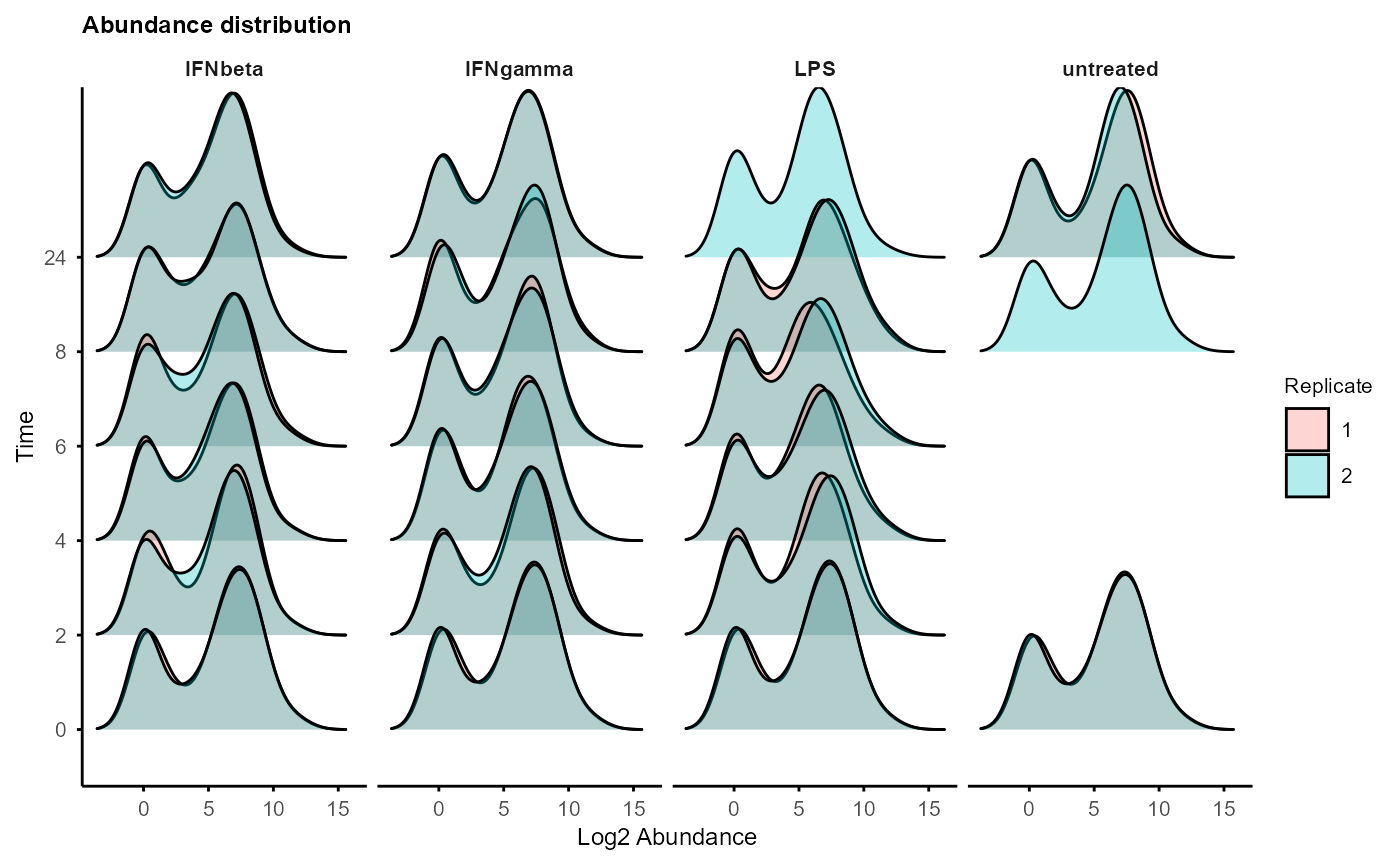
 plot_distribution(example_obj, facet_by = "Group")
#> Picking joint bandwidth of 1.28
#> Picking joint bandwidth of 1.27
#> Picking joint bandwidth of 1.23
#> Picking joint bandwidth of 1.26
plot_distribution(example_obj, facet_by = "Group")
#> Picking joint bandwidth of 1.28
#> Picking joint bandwidth of 1.27
#> Picking joint bandwidth of 1.23
#> Picking joint bandwidth of 1.26