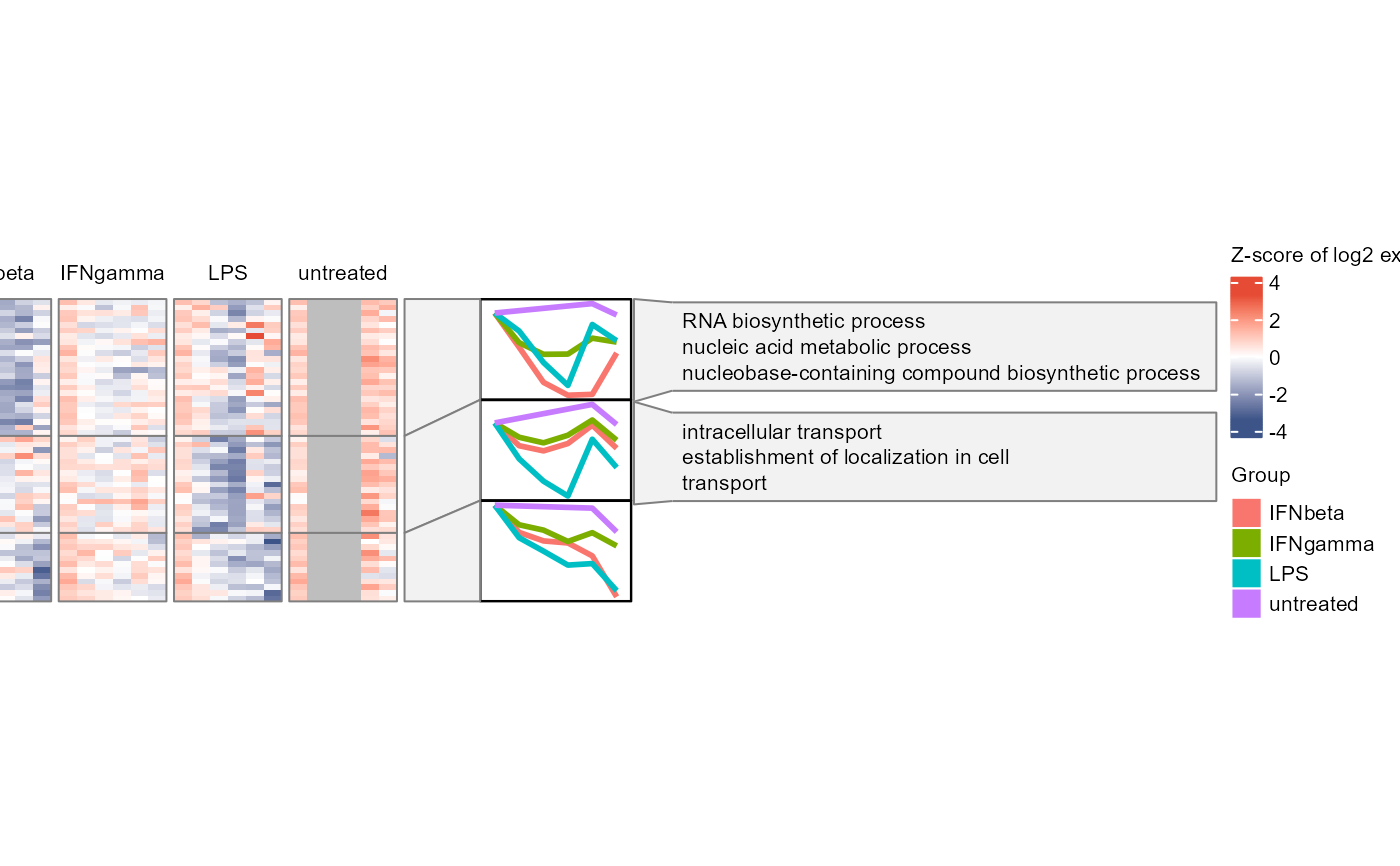
Plot WGCNA modules' heatmaps, mean expression profiles, and enrichment terms, aligned horizontally.
Different from running WGCNA, the input data should have the replicates merged, instead of having multiple samples per group, time and feature (gene).
If certain time points are missing in some groups, NA values are added.
Usage
plot_modules_h(
  module,
  se_obj_merged,
  scale = TRUE,
  assay = 2,
  ylabel = "Log2 abundance",
  profile_width = 3,
  profile_link_width = 1,
  enrich_list = NULL,
  enrich_category = "BP",
  enrich_rank_by = "p.adjust",
  enrich_top_n = 3,
  enrich_p_threshold = 0.05,
  fontsize = 8,
  heatmap_width = 8,
  heatmap_height = 8,
  mark_features = NULL,
  width = 16,
  height = 12,
  res = 300,
  suffix = "",
  device = "png",
  save = NULL
)
Arguments
- module
A data frame with columns "Feature" and "Module"
- se_obj_merged
A SummarizedExperiment object, with one value for each feature at each time point in each group (replicates merged). The colData of the object should contain columns "Sample", "Group", and "Time". The object can be produced by
split_groups(),merge_replicates()andmerge_groups().- scale
Whether to scale the data (z-score) across samples for each feature (default is TRUE)
- assay
The assay index in the SummarizedExperiment object to use (default is 2, time 0 normalised data)
- ylabel
Y axis label prefix (default is "Log2 abundance")
- profile_width
Width of the mean expression profile panels in cm (default: 3)
- profile_link_width
Width of the link between heatmap and mean expression profile panels in cm (default: 1)
- enrich_list
A named enrichment list for modules, as produced by
enrichGO_list()$all. Each named element should be a data.frame with columnsCluster,Description, and the rank column. Accepts any enrichment result with compatible format. Whenenrich_categoryis a vector, each category is shown as a separate column in the annotation textbox. If NULL (default), no enrichment terms will be displayed.- enrich_category
Category name(s) of enrichment to display: a single string (e.g.
"BP"), or a vector for multiple categories (e.g.c("BP", "CC", "Hub features")). When"Hub features"is included,mark_featuresare shown as a column in the textbox.- enrich_rank_by
Column to rank enrichment terms. A single string (default:
"p.adjust") is recycled for all categories inenrich_category. Supply a character vector of matching length for per-category control. Also used for colour-coding: terms with values belowenrich_p_thresholdare shown in black, terms above in grey.- enrich_top_n
Top N enrichment terms per module. A single integer (default: 3) is recycled for all categories in
enrich_category. Supply an integer vector of matching length for per-category control.- enrich_p_threshold
P-value / adjusted p-value threshold for colour-coding enrichment terms. A single value (default: 0.05) is recycled for all categories; supply a vector of matching length for per-category control. Terms below threshold are drawn in black, terms above in grey70. Set to
NULLto skip colour-coding (all terms black). Set toNAfor"Hub features".- fontsize
Base font size (default: 8)
- heatmap_width
Width of the heatmap body in cm (default: 8)
- heatmap_height
Height of the heatmap body in cm (default: 8). Set to
NULLto auto-size.- mark_features
Features to label. Accepts two forms:
A character vector: all marked in black on the left.
A named list of character vectors, e.g.
list("Hub 1" = c("gene1"), "Hub 2" = c("gene2")). Names become categories with auto-assigned colours (viaggsci::pal_jco()). Auto-routed: shown asanno_mark(left side, connecting lines) unless"Hub features"is present inenrich_category, in which case ananno_multicol_textbox(right side) is built instead, using the same colours. Set toNULL(default) to skip marking.
- width
Width of the saved image (default is 16 (cm))
- height
Height of the saved image (default is 12 (cm))
- res
Resolution of the saved image (except pdf format) (default: 300 (ppi))
- suffix
Suffix for the saved image file name (default: "")
- device
Image file format(s) for saving. Can be a character vector with one or more of
"png","pdf","tiff","jpeg"(default:"png")- save
Directory to save plot, NULL (default) for no saving.
Value
A combined plot of heatmap, mean expression profile, and enrichment terms for each WGCNA module
Examples
data(example_obj)
example_obj <- normalise_to_start(example_obj)
#> Normalising to group baseline at each feature's first non-NA time point.
example_obj_list <- split_groups(example_obj)
example_obj_merged_list <- merge_replicates(example_obj_list)
example_obj_merged <- merge_groups(example_obj_merged_list)

data(example_net)
# select two modules for demonstration
example_module <- WGCNA_module(example_net) |>
    dplyr::filter(Module %in% c("1", "2"))

data(example_go)

plot_modules_h(example_module |> dplyr::filter(Module != '0'),
    example_obj_merged, scale = TRUE,
    ylabel = "Z-score of log2 expression",
    enrich_list = example_go$all,
    enrich_category = "BP",
    heatmap_width = 6, heatmap_height = 4)
#> Warning: Removed 156 rows containing non-finite outside the scale range
#> (`stat_summary()`).
#> Warning: Removed 48 rows containing non-finite outside the scale range
#> (`stat_summary()`).