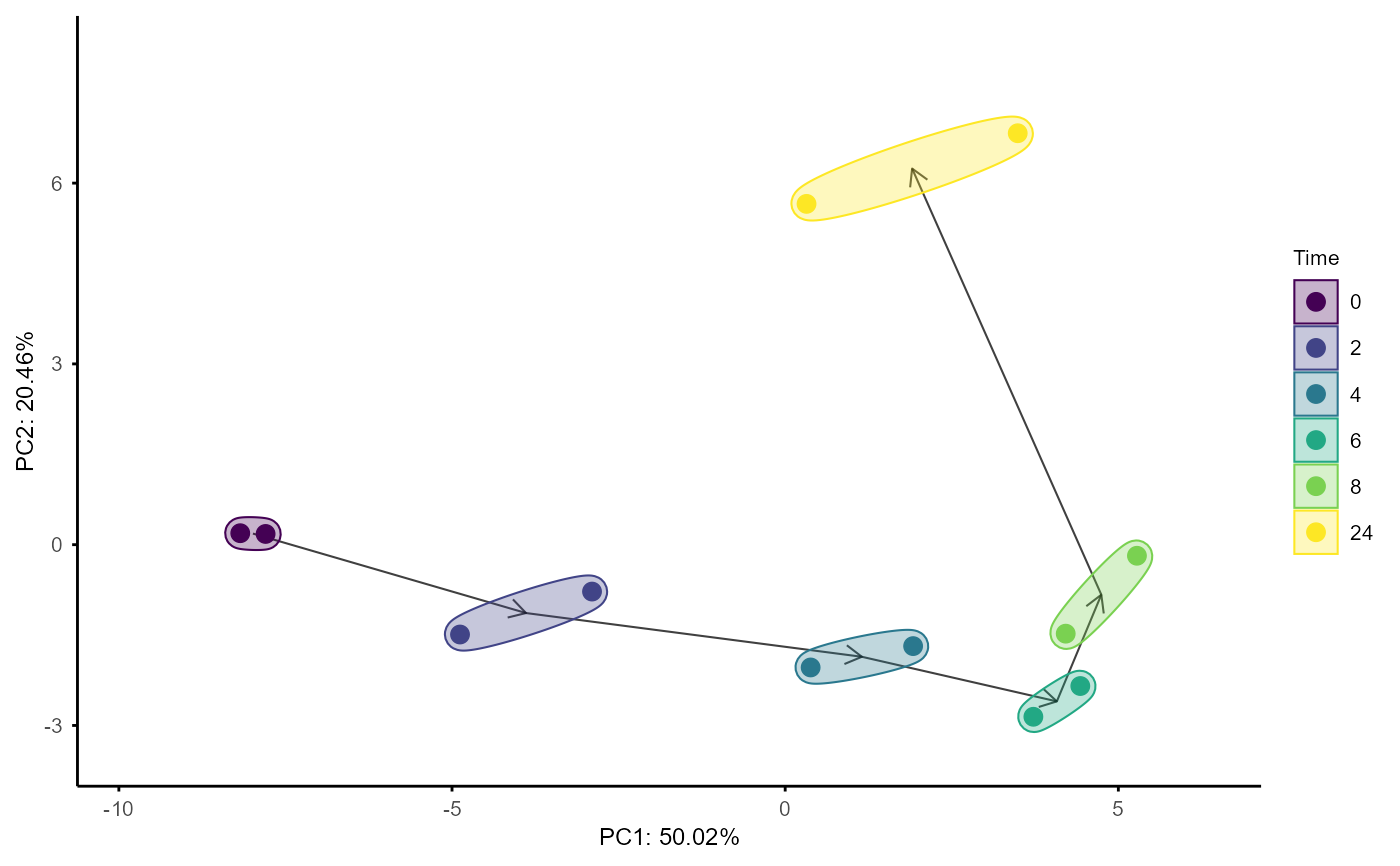
Plot PCA with arrows indicating trajectory over time, for a single group.
Usage
plot_pca_arrows(
  se_obj,
  circle = TRUE,
  arrow = TRUE,
  pc1 = 1,
  pc2 = 2,
  fontsize = 8,
  assay = 1
)
Arguments
- se_obj
A SummarizedExperiment object (single group).
- circle
Logical, whether to draw ellipses around samples of each time point (default: TRUE).
- arrow
Logical, whether to draw arrows indicating the trajectory over time (default: TRUE).
- pc1
Principal component for the x-axis (default: 1).
- pc2
Principal component for the y-axis (default: 2).
- fontsize
Base font size (default: 8).
- assay
Assay index to use, where 1 is the original data and 2 is normalised to time 0 (if available) (default: 1).
Examples
data(example_obj)
plot_pca_arrows(example_obj[, example_obj$Group == "IFNbeta"])
#> Warning: Using size for a discrete variable is not advised.