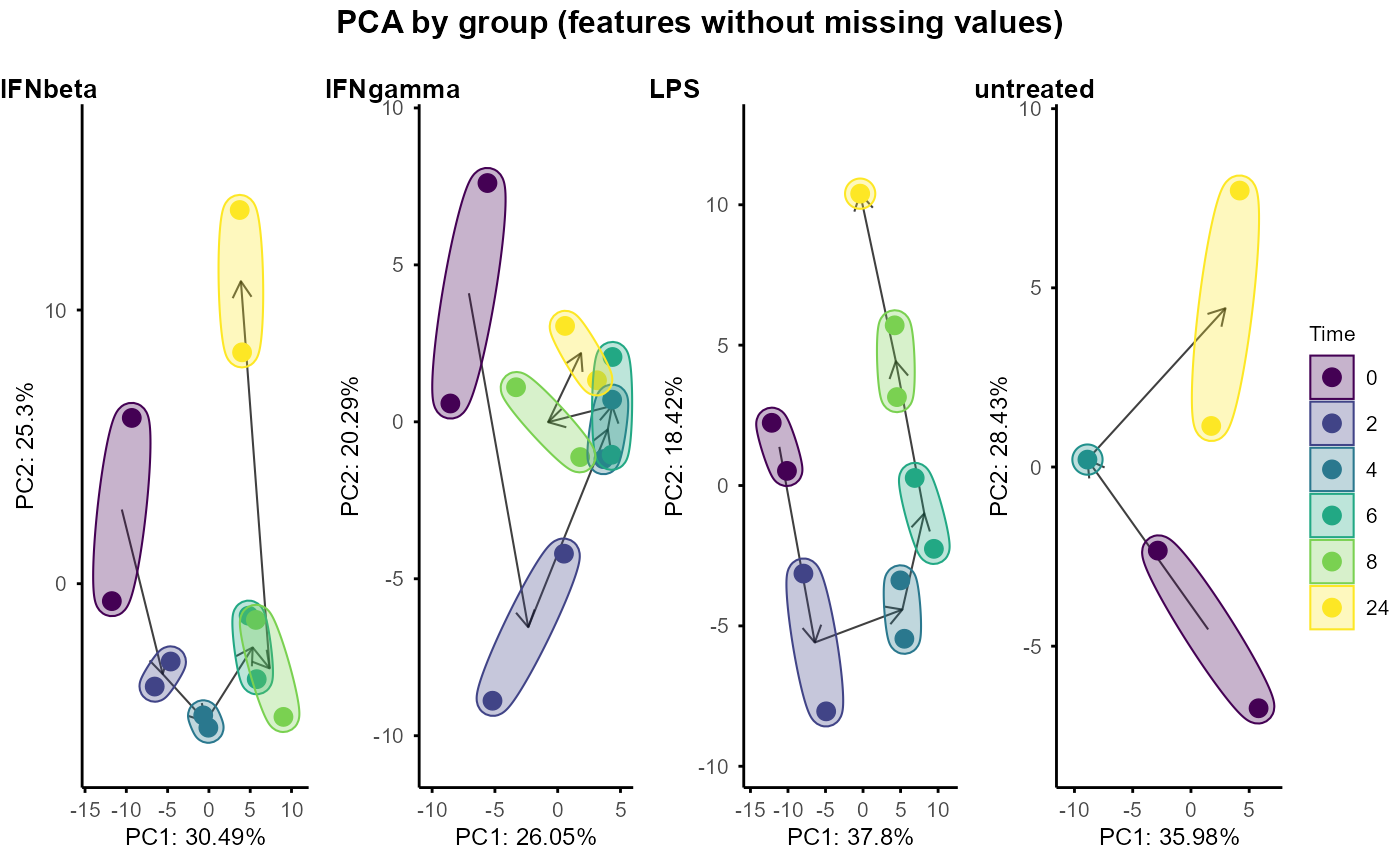
Plot PCA for each group separately, with optional circles
around time points and arrows indicating trajectory over time. Accepts
either a SummarizedExperiment object or a list of them (from
split_groups()).
Usage
plot_pca_by_group(
  se_obj,
  circle = TRUE,
  arrow = TRUE,
  pc1 = 1,
  pc2 = 2,
  nrow = 1,
  fontsize = 8,
  assay = 1,
  legend_pos = "right"
)
Arguments
- se_obj
A SummarizedExperiment object, or a named list of them (e.g. from
split_groups()).- circle
Logical, whether to draw ellipses around samples of each time point (default: TRUE).
- arrow
Logical, whether to draw arrows indicating the trajectory over time (default: TRUE).
- pc1
Principal component for the x-axis (default: 1).
- pc2
Principal component for the y-axis (default: 2).
- nrow
Number of rows for arranging the plots (default: 1).
- fontsize
Base font size (default: 8).
- assay
Assay index to use, where 1 is the original data and 2 is normalised to time 0 (if available) (default: 1).
- legend_pos
Legend position (default: "right").
Examples
data(example_obj)
plot_pca_by_group(example_obj, circle = TRUE, arrow = TRUE)
#> Warning: Using size for a discrete variable is not advised.
#> Warning: Using size for a discrete variable is not advised.
#> Warning: Using size for a discrete variable is not advised.
#> Warning: Using size for a discrete variable is not advised.
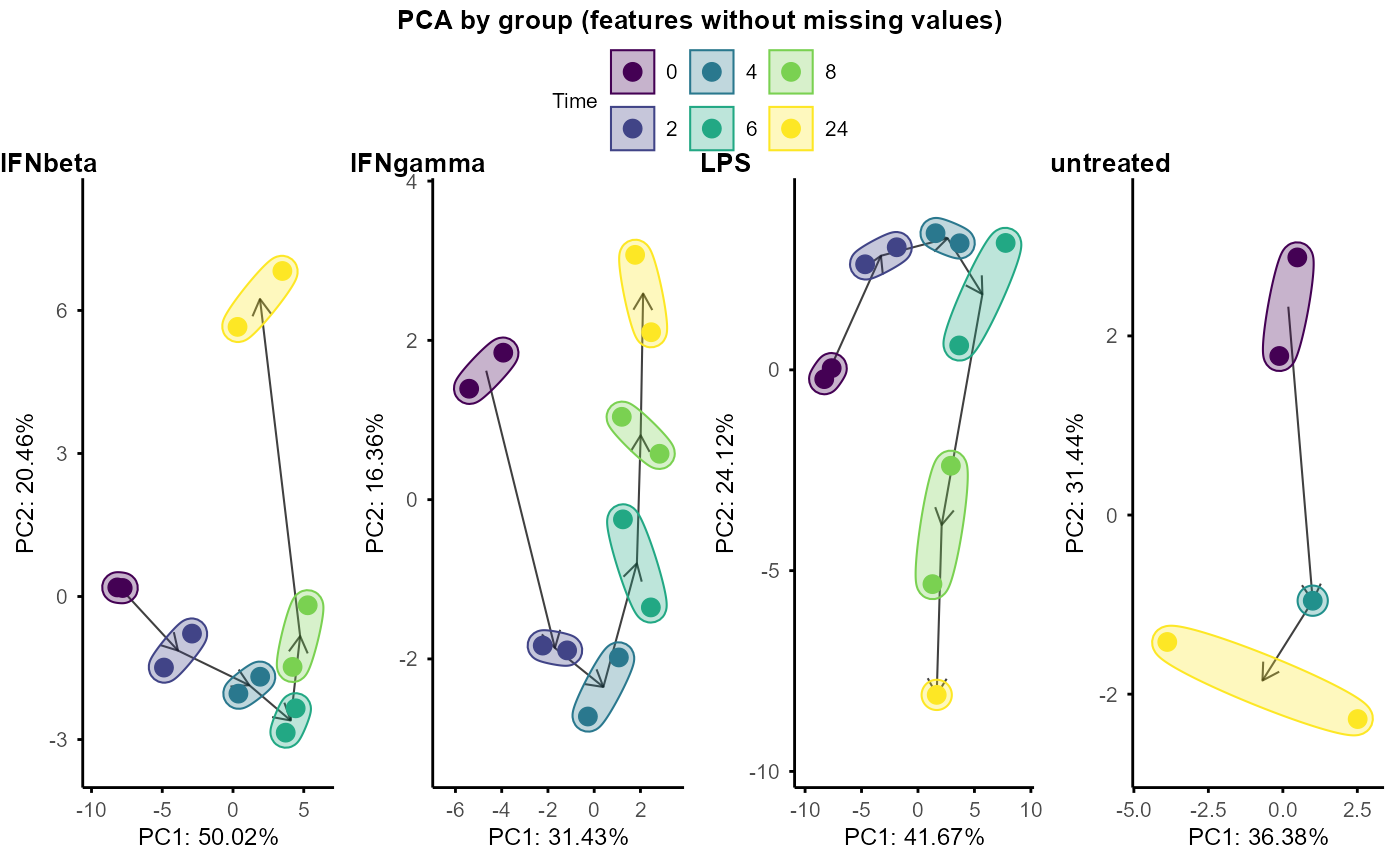 # Also accepts a list from split_groups()
example_obj_list <- split_groups(example_obj)
plot_pca_by_group(example_obj_list)
#> Warning: Using size for a discrete variable is not advised.
#> Warning: Using size for a discrete variable is not advised.
#> Warning: Using size for a discrete variable is not advised.
#> Warning: Using size for a discrete variable is not advised.
# Also accepts a list from split_groups()
example_obj_list <- split_groups(example_obj)
plot_pca_by_group(example_obj_list)
#> Warning: Using size for a discrete variable is not advised.
#> Warning: Using size for a discrete variable is not advised.
#> Warning: Using size for a discrete variable is not advised.
#> Warning: Using size for a discrete variable is not advised.