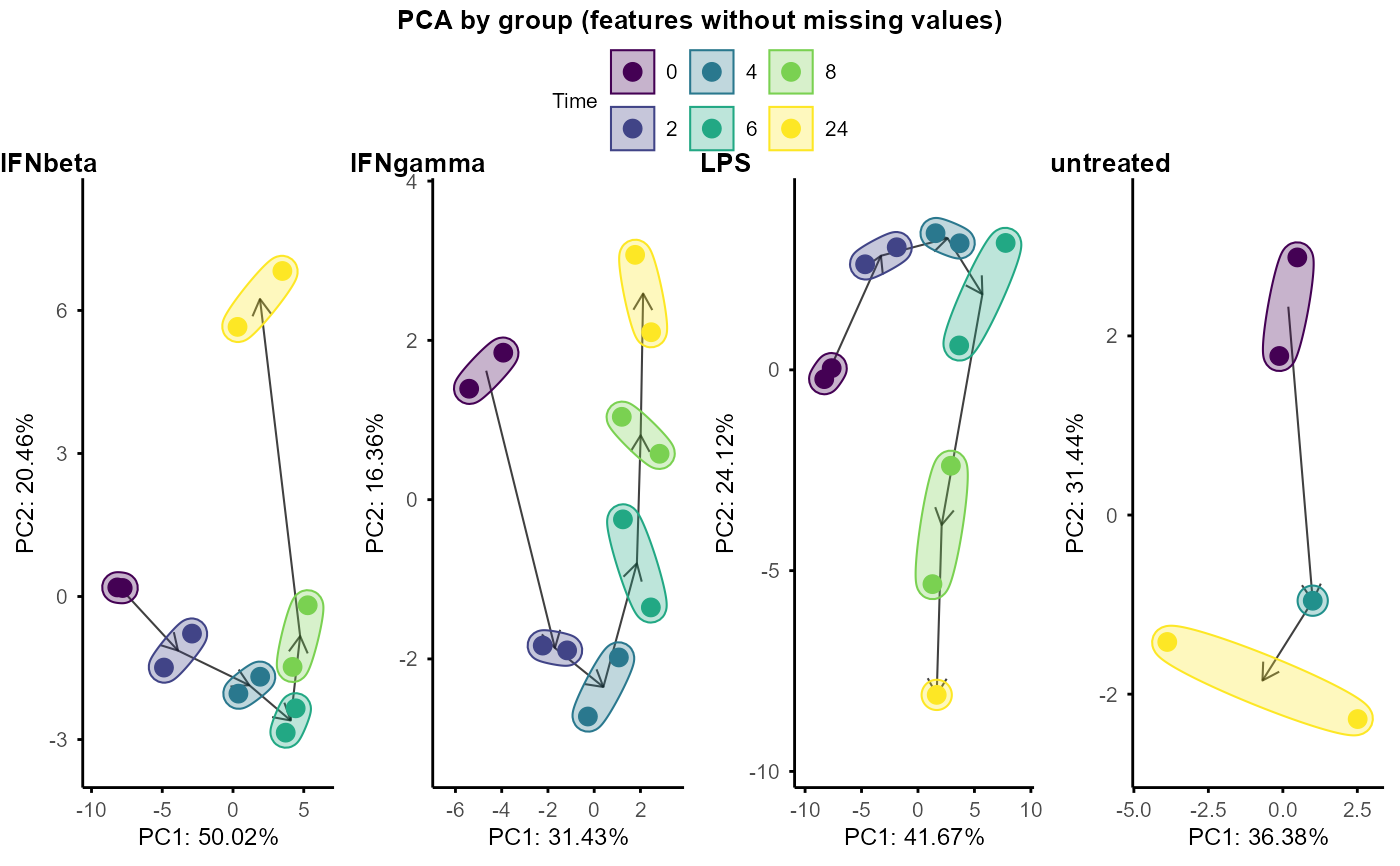
Plot PCA by group, input is a list of SummarizedExperiment objects, with each object corresponding to a group
Usage
plot_pca_by_group_list(
  se_obj_list,
  circle = TRUE,
  arrow = TRUE,
  nrow = 1,
  fontsize = 8,
  assay = 1
)
Arguments
- se_obj_list
A list of SummarizedExperiment objects, such as output of
split_groups()- circle
Logical, whether to draw circles (ellipses) around samples of each time point (default is TRUE)
- arrow
Logical, whether to draw arrows indicating the trajectory over time (default is TRUE)
- nrow
Number of rows for arranging the PCA plots (default is 1)
- fontsize
Font size for the PCA plots (default is 8)
- assay
Assay index to use, where 1 is the original data and 2 is normalised to time 0 (if available) (default is 1)
Examples
data("example")
example_obj_list <- split_groups(example_obj)
plot_pca_by_group_list(example_obj_list)
#> Warning: Removed 1 row containing missing values or values outside the scale range
#> (`geom_segment()`).
#> Warning: Removed 1 row containing missing values or values outside the scale range
#> (`geom_segment()`).
#> Warning: Removed 1 row containing missing values or values outside the scale range
#> (`geom_segment()`).
#> Warning: Removed 1 row containing missing values or values outside the scale range
#> (`geom_segment()`).
#> Warning: Removed 1 row containing missing values or values outside the scale range
#> (`geom_segment()`).