Plot UMAP for each group separately. Accepts either a
SummarizedExperiment object or a named list of them (from
split_groups()).
Usage
plot_umap_by_group(
  se_obj,
  seed = 1234,
  nrow = 1,
  umap_neighbors = NULL,
  fontsize = 8,
  assay = 1,
  legend_pos = "right"
)
Arguments
- se_obj
A SummarizedExperiment object, or a named list of them (e.g. from
split_groups()).- seed
Random seed for UMAP (default: 1234).
- nrow
Number of rows for arranging the plots (default: 1).
- umap_neighbors
UMAP n_neighbors parameter (default: auto-selected based on sample count).
- fontsize
Base font size (default: 8).
- assay
Assay index to use, where 1 is the original data and 2 is normalised to time 0 (if available) (default: 1).
- legend_pos
Legend position (default: "right").
Examples
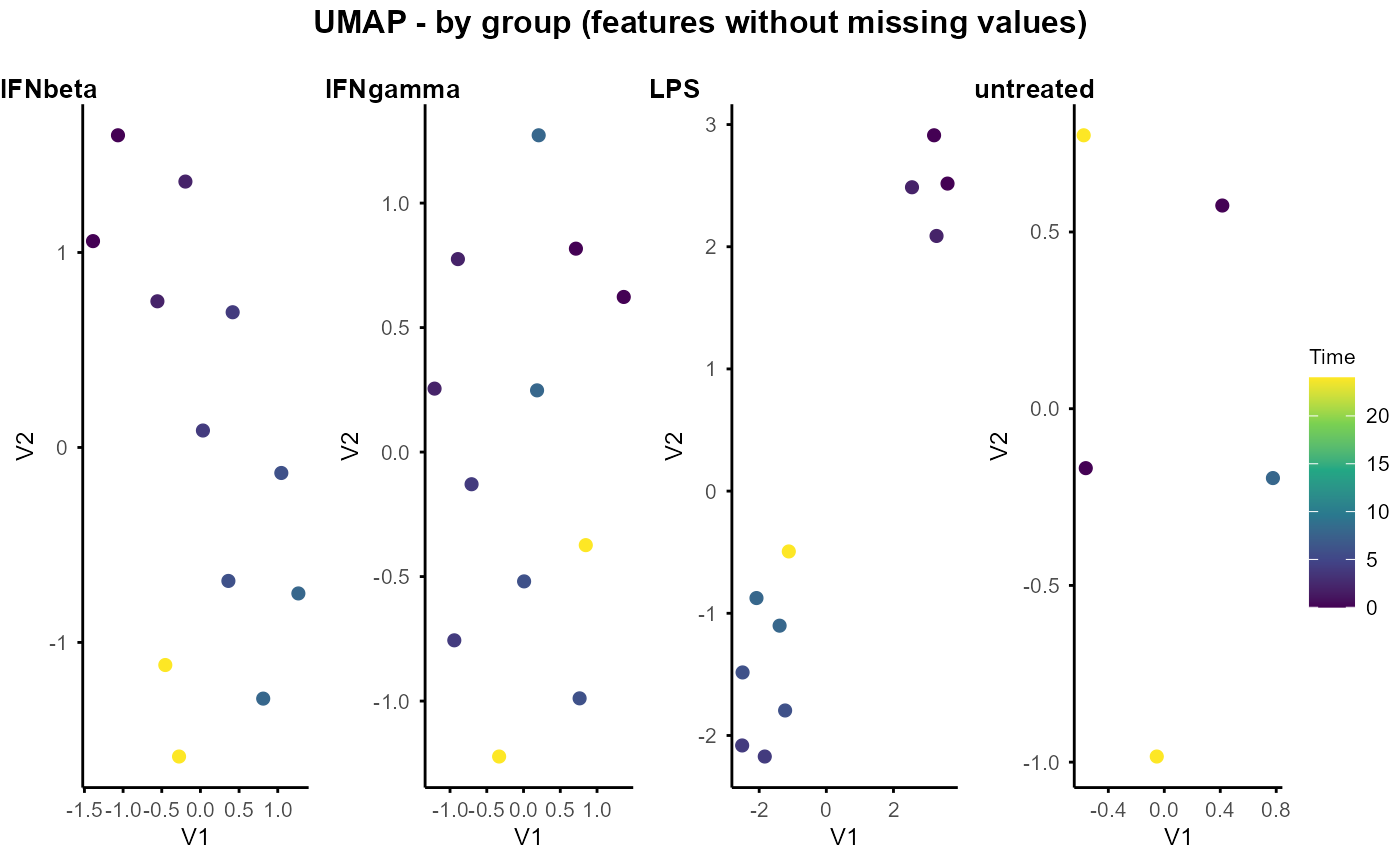
data(example_obj)
plot_umap_by_group(example_obj)
#> Using n_neighbors = 5
#> Warning: Using size for a discrete variable is not advised.
#> Using n_neighbors = 5
#> Warning: Using size for a discrete variable is not advised.
#> Using n_neighbors = 5
#> Warning: Using size for a discrete variable is not advised.
#> Using n_neighbors = 4
#> Warning: Using size for a discrete variable is not advised.
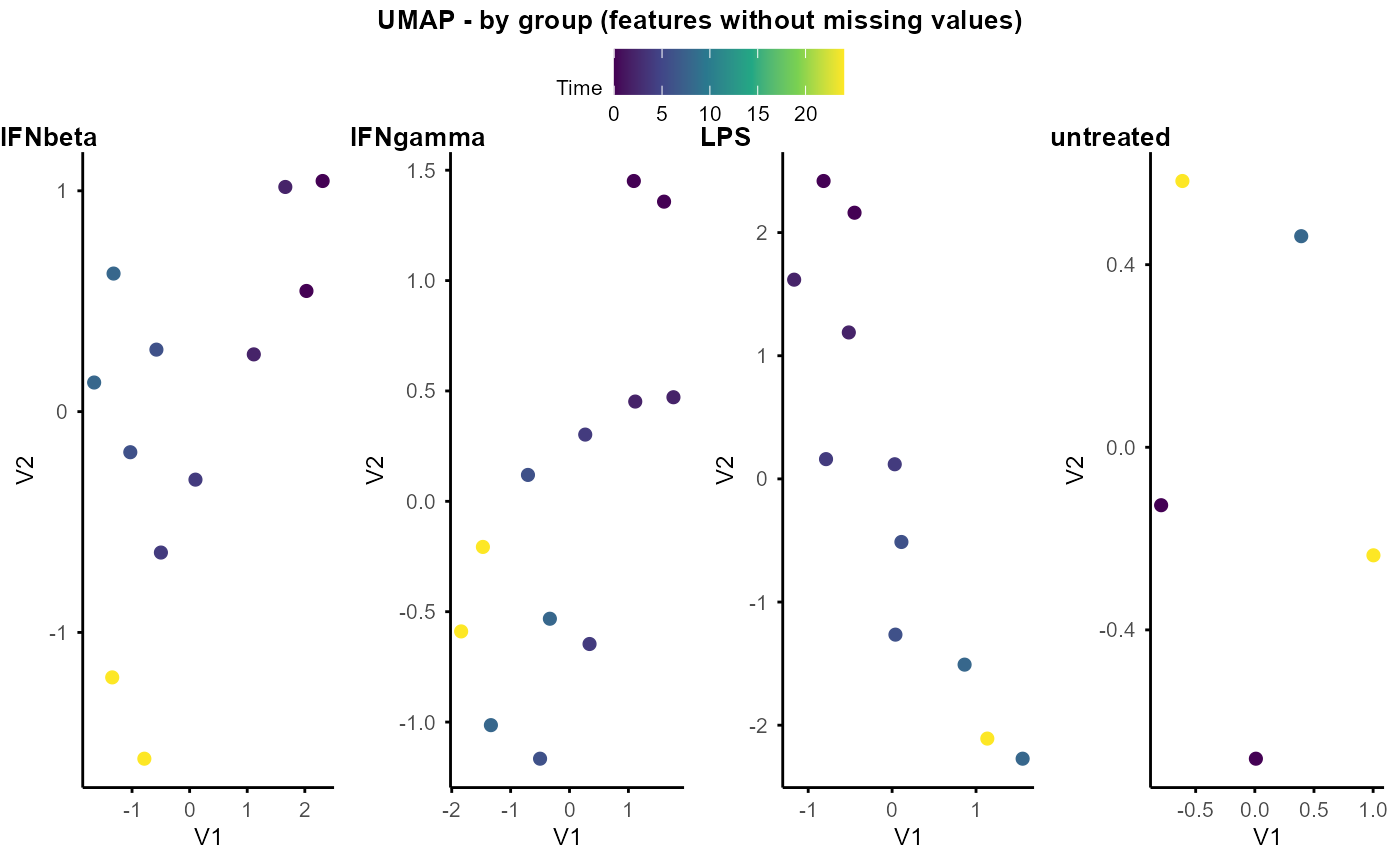 # Also accepts a list from split_groups()
example_obj_list <- split_groups(example_obj)
plot_umap_by_group(example_obj_list)
#> Using n_neighbors = 5
#> Warning: Using size for a discrete variable is not advised.
#> Using n_neighbors = 5
#> Warning: Using size for a discrete variable is not advised.
#> Using n_neighbors = 5
#> Warning: Using size for a discrete variable is not advised.
#> Using n_neighbors = 4
#> Warning: Using size for a discrete variable is not advised.
# Also accepts a list from split_groups()
example_obj_list <- split_groups(example_obj)
plot_umap_by_group(example_obj_list)
#> Using n_neighbors = 5
#> Warning: Using size for a discrete variable is not advised.
#> Using n_neighbors = 5
#> Warning: Using size for a discrete variable is not advised.
#> Using n_neighbors = 5
#> Warning: Using size for a discrete variable is not advised.
#> Using n_neighbors = 4
#> Warning: Using size for a discrete variable is not advised.