<<<<<<< Updated upstream

UMAP by group (list of objects)
=======Plot UMAP by group (list of objects)
>>>>>>> Stashed changes Source:R/plot_umap_by_group.R
plot_umap_by_group_list.RdPlot UMAP by group, input is a list of SummarizedExperiment objects, with each object corresponding to a group
Usage
plot_umap_by_group_list(
  se_obj_list,
  seed = 1234,
  nrow = 1,
  umap_neighbors = NULL,
  fontsize = 8,
  assay = 1
)
Arguments
- se_obj_list
A list of SummarizedExperiment objects, such as output of
split_groups()- seed
Random seed for UMAP (default is 1234)
- nrow
Number of rows for arranging the UMAP plots (default is 1)
- umap_neighbors
UMAP n_neighbors parameter (default is selected by
umap_n_neighbors()function based on the number of samples)- fontsize
Font size for the plot (default is 8)
- assay
Assay index to use, where 1 is the original data and 2 is normalised to time 0 (if available) (default is 1)
Examples
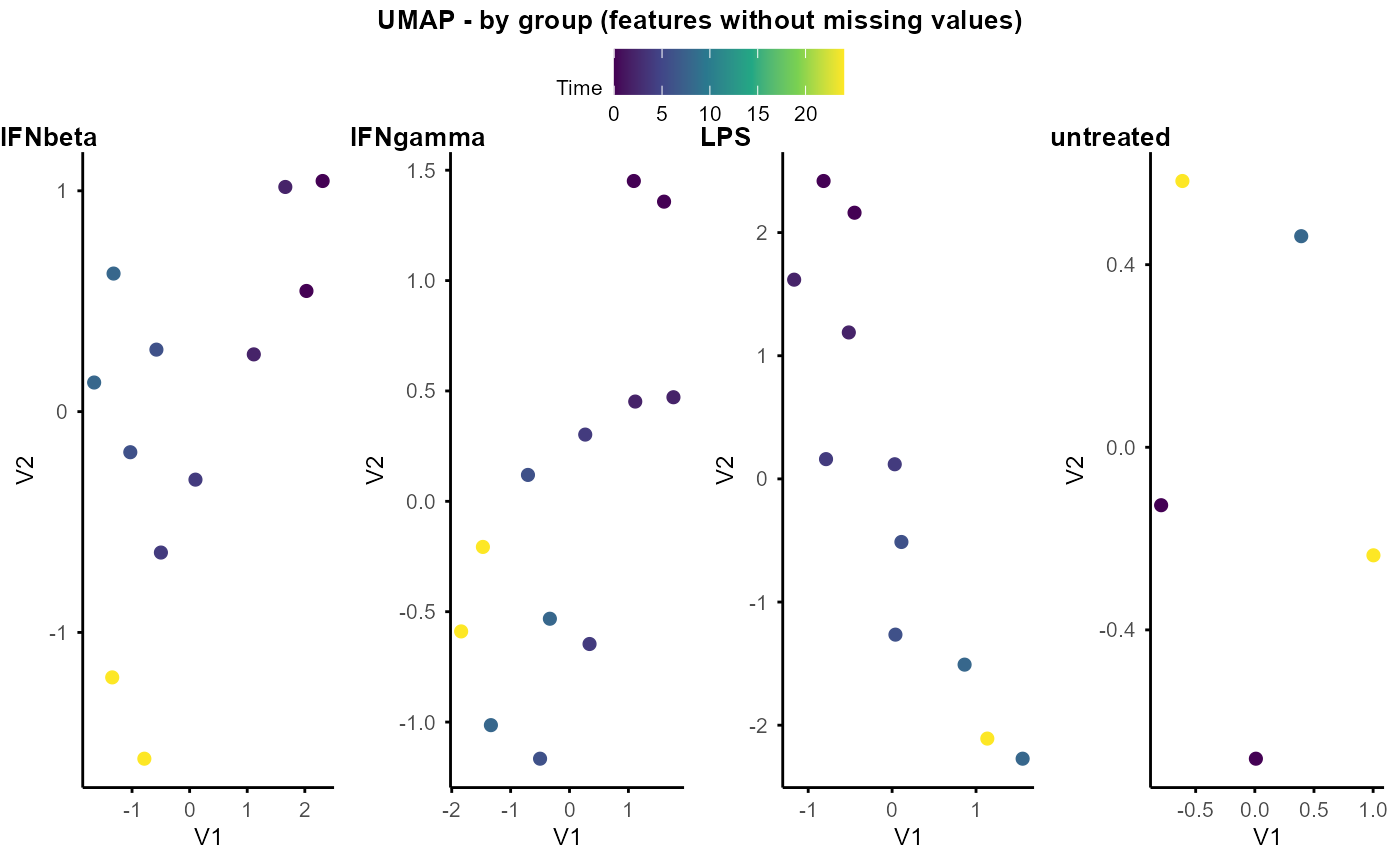
data("example")
example_obj_list <- split_groups(example_obj)
plot_umap_by_group_list(example_obj_list)
#> Using n_neighbors = 5
#> Using n_neighbors = 5
#> Using n_neighbors = 5
#> Using n_neighbors = 4