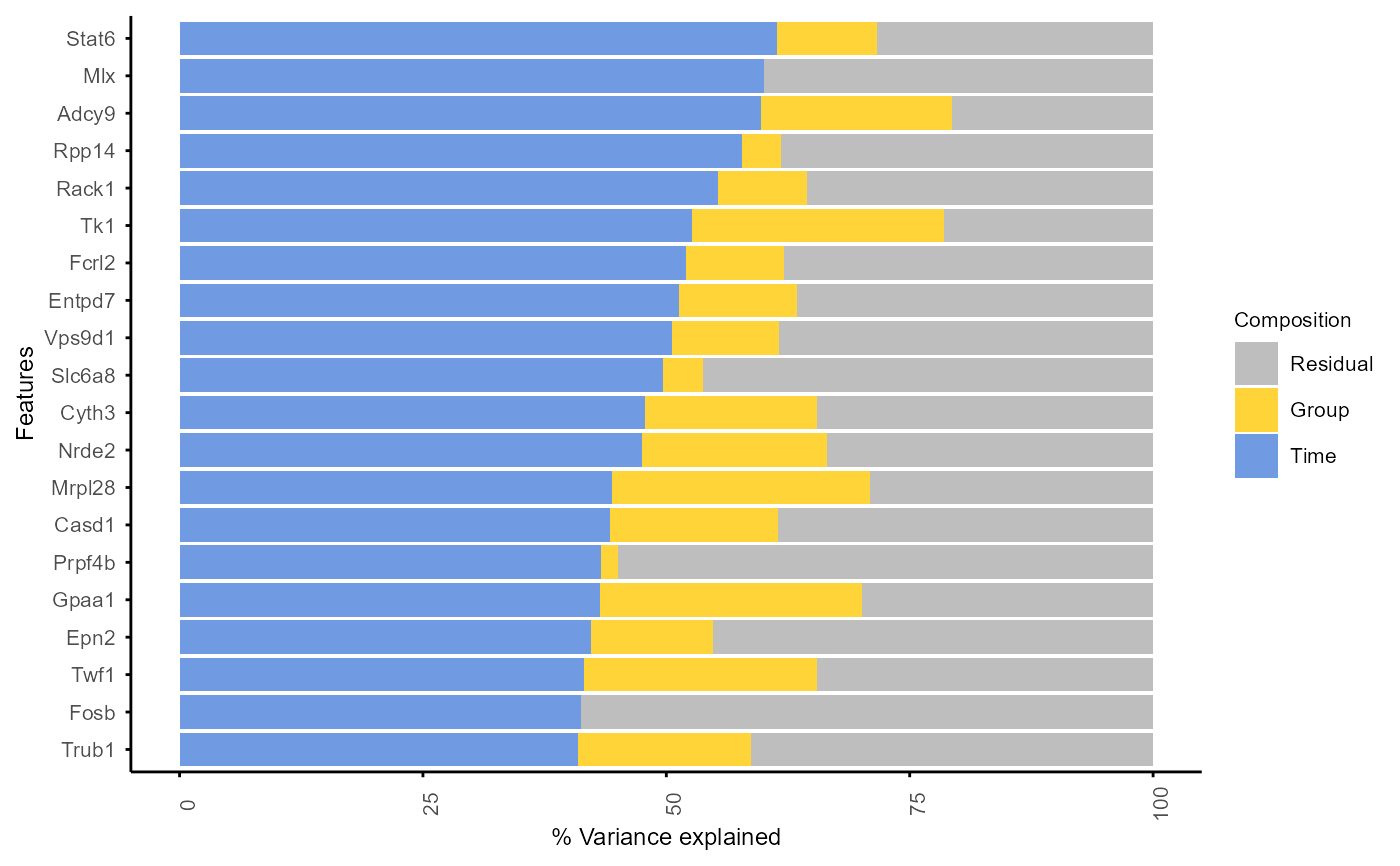
Based on PALMO::variancefeaturePlot() function
Usage
plot_variance(
  var_decomp,
  rank = "Group",
  features = NULL,
  top_n = 20,
  show_ylab = TRUE,
  fontsize = 8
)
Arguments
- var_decomp
A data frame output from
decomp_variance()- rank
Rank the plot by selected variable (default is "Group")
- features
Features to be plotted (default is NULL)
- top_n
Top n features ranked by
rankto be plotted whenfeaturesis not specified (default is 20)- show_ylab
Whether to show y axis text (default is TRUE)
- fontsize
Font size for the plot (default is 8)
Value
A stacked bar plot showing the percentage of variance explained
by each model component (Group, Time, Residual, plus Subject and
interaction terms when present). Features
are ranked by the specified rank variable (Group or Time) and only the
top n features are plotted if features is not specified.
Examples
data(example_obj)
example_obj <- normalise_to_start(example_obj)
#> Normalising to group baseline at each feature's first non-NA time point.

var_decomp <- decomp_variance(example_obj, assay = 1)
#> LMM: exp ~ (1|Group) + (1|Time)  |  Output: Group, Time, Residual
plot_variance(var_decomp, rank = "Time", top_n = 20)
#> Features not specified. Plotting top 20 features ranked by Time.