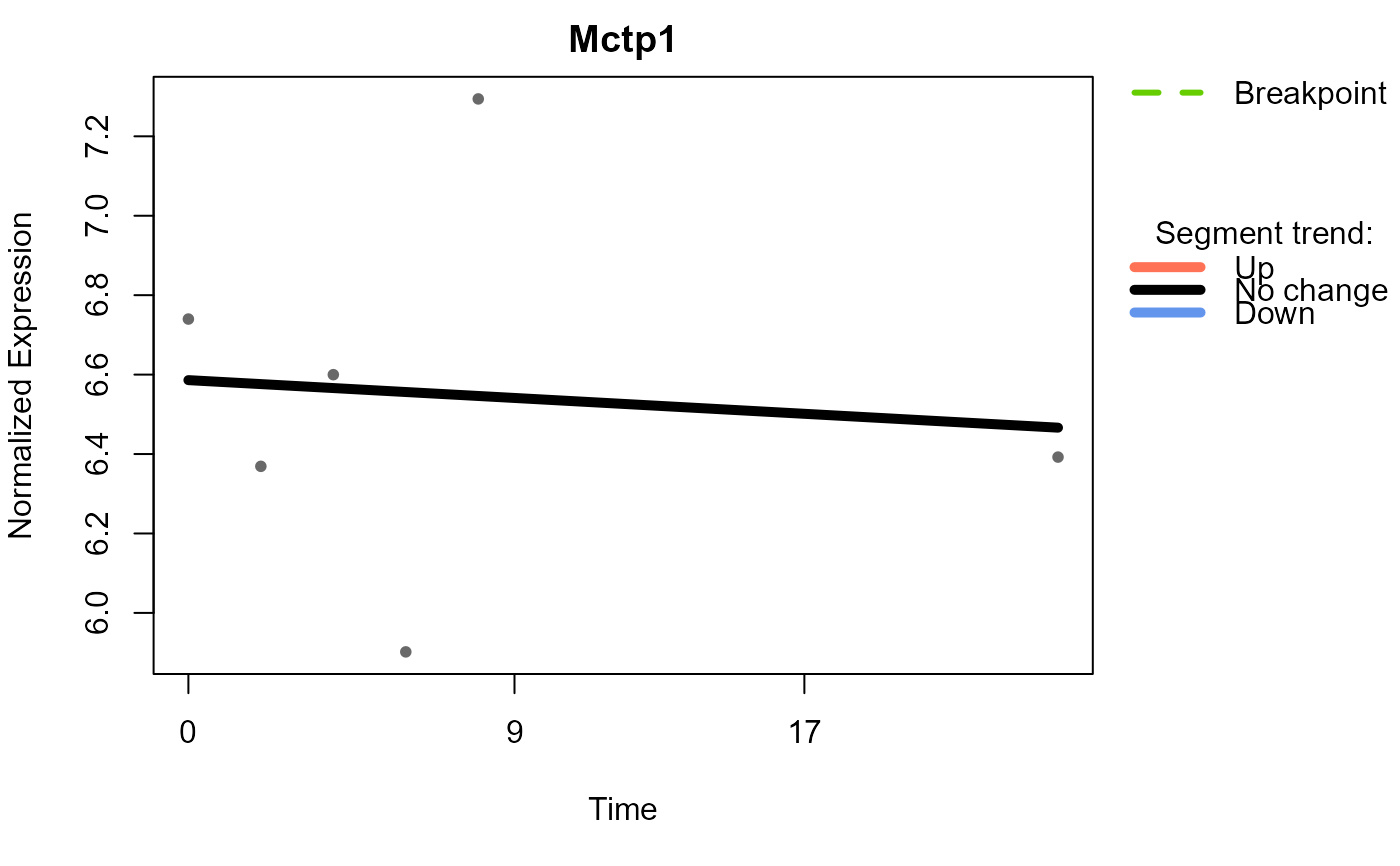
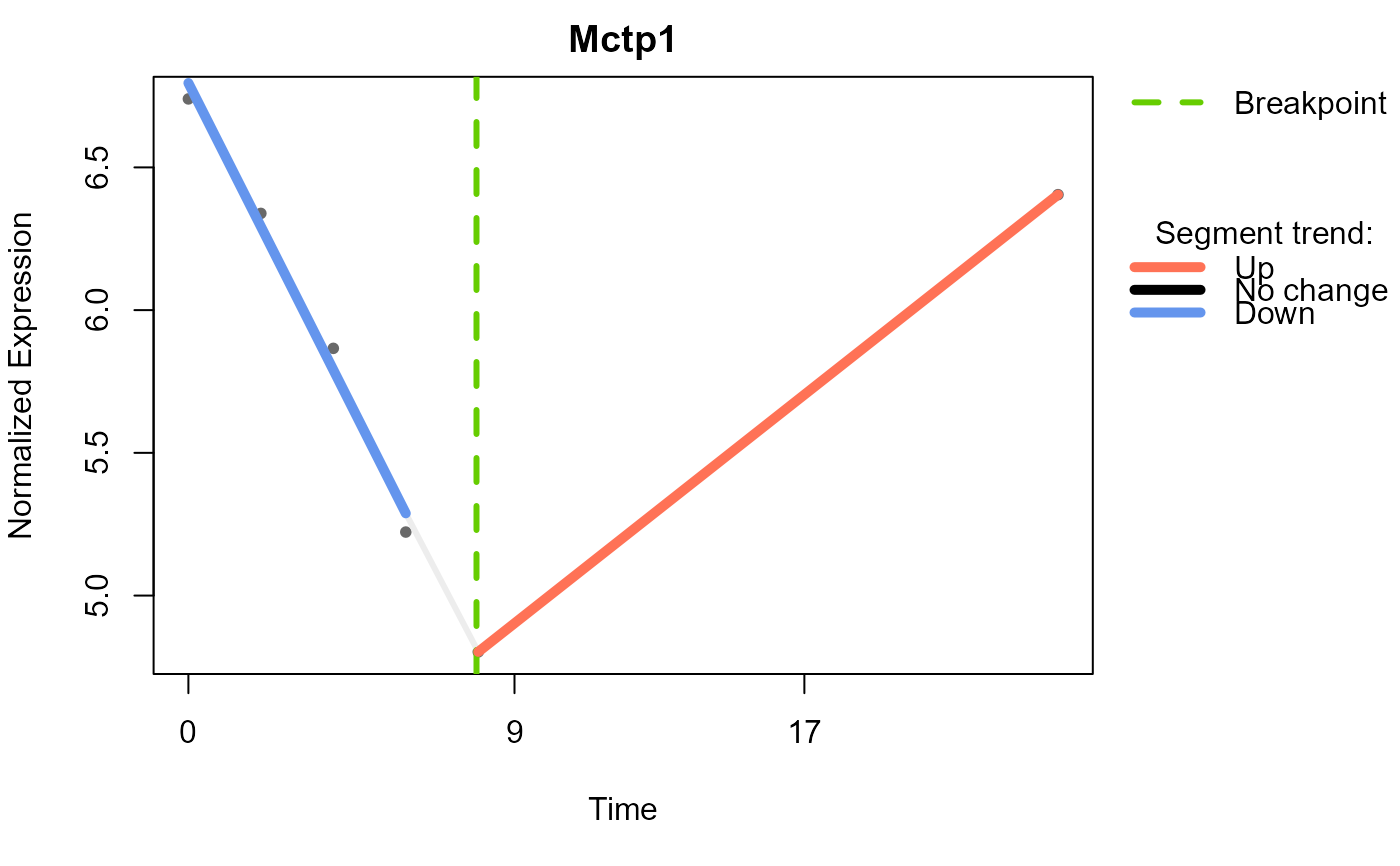
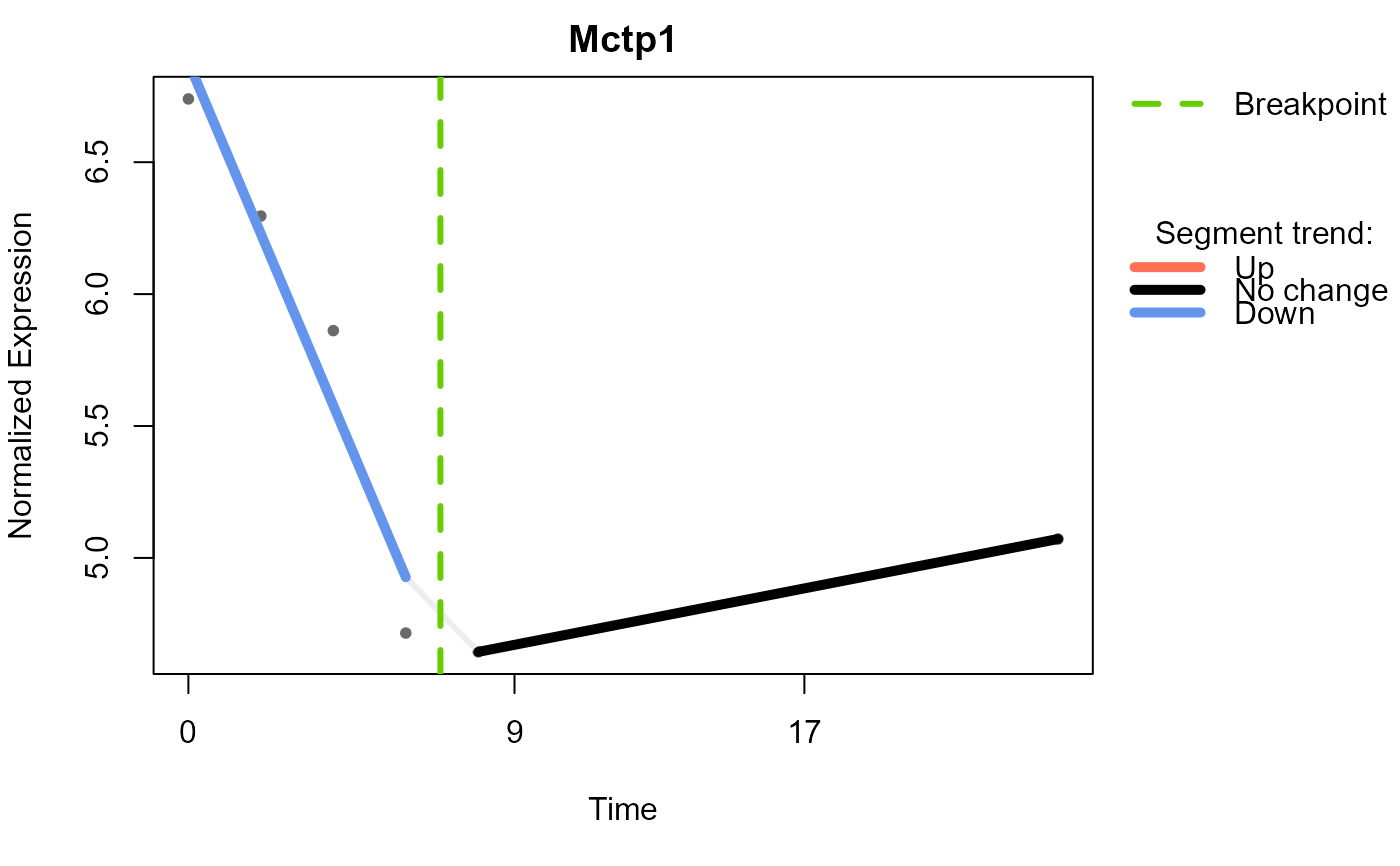
Plot segmented regression results for specified features
in each group, using the Trendy::plotFeature() function. The input is
a list of SummarizedExperiment objects with no missing values and a list
of Trendy analysis results for each group.
Arguments
- se_obj_imp_list
A list of SummarizedExperiment objects with no missing values
- res_list
A list of the Trendy analysis results, output of
run_Trendy()- feature
A character vector of feature names to be plotted
- group
A character vector of group names to be analysed. If NULL, all groups in the input list will be used (default is NULL)
- nrow
Number of rows in the plot layout. If NULL and multiple features are provided, it will be set to half the number of features (rounded up) (default is NULL)
- ...
Additional arguments to be passed to the
Trendy::plotFeature()
Examples
data(example_obj)
example_obj <- normalise_to_start(example_obj)
#> Normalising to group baseline at each feature's first non-NA time point.
example_obj_list <- split_groups(example_obj)
example_obj_merged_list <- merge_replicates(example_obj_list)
example_obj_merged_list <-
    calc_feature_property(example_obj_merged_list, threshold = 0)
# no missing value in the example dataset, so imputation is not necessary
example_obj_merged_imp_list <- impute_groups(example_obj_merged_list)
#> Group IFNbeta: no missing values.
#> Group IFNgamma: no missing values.
#> Group LPS: no missing values.
#> Group untreated: no missing values.

data("example_res_list")
plot_segments(example_obj_merged_imp_list, example_res_list,
    feature = c("Kif3a"))
#> Plotting segmented regression for group: IFNbeta

#> Plotting segmented regression for group: IFNgamma

#> Plotting segmented regression for group: LPS